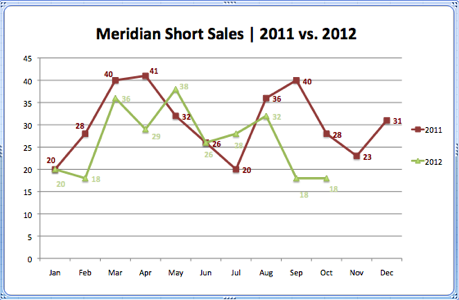
The number of Meridian ID short sales has gone down compared to one year ago. In fact, according to the chart below, most months this year have either been under or posted the same number as in 2011, with a couple exceptions. For example, during the month of July there were 28 short sales; there were 20 in July 2011. Still, last year there was an average of 30 short sales in Meridian each month. And while the year isn’t quite over yet, the average for 2012 is 26.

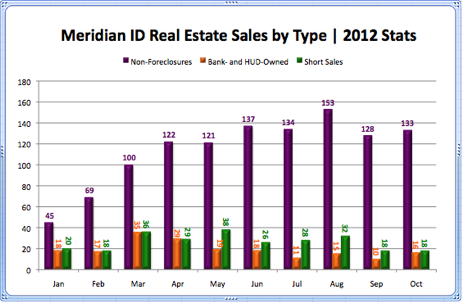
While data shows Meridian ID short sales have gone down compared to one year ago, these types of sales exceed Meridian bank-owned and HUD properties. The graph below shows that most months had similar numbers, except for the summer months. It’s interesting to point out, though, that foreclosure sales were significantly down compared to traditional sales.

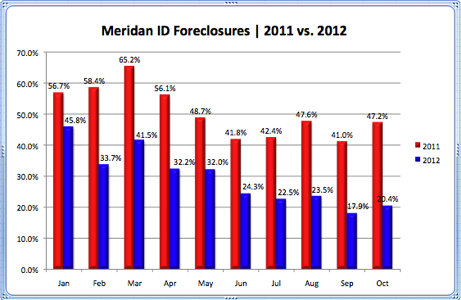
The foreclosure market share is also significantly smaller because Meridian ID short sales and bank-owned homes have slowed since 2011. You can see that since the month of June, foreclosures have consistently made up less than 25% of total sales. Those are numbers we haven’t seen since IMLS started collecting data in 2009.


