Meridian Idaho Short Sale Update | 2013

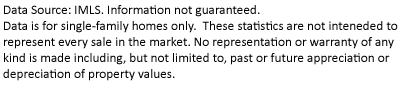
Short sales have dropped significantly this year in Meridian by about 49%. In total, there were 306 short sales last year compared to only 144 sold to date in 2013. Short sales peaked last year in May at 38, and then dropped to their lowest in the last couple of months; 6 in October and 7 in November. The significant decline started last fall and continued to decrease with various peaks, but started to fall dramatically in the late summer of ’13.

Meridian Short Sales '13vs.'12

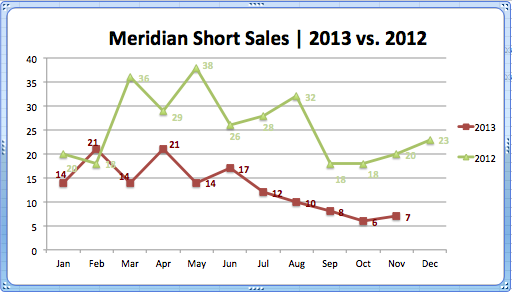
Not only have the number of short sales declined in Meridian this year, but we are also seeing the same drop in the number of bank-owned and HUD home sales. As you can see in the graph below, in the last two years, bank-owned and HUD homes peaked at 35 in March of 2012, however in just one year they dropped to just 2 in March of this year. That is a 94% decline in 12 months short months. On average this year, bank-owned and HUD homes have dropped by 39%. This is slightly lower than the drop in short sales which have dropped by 49%.

Meridian Bank Owned:HUD '13vs.'12

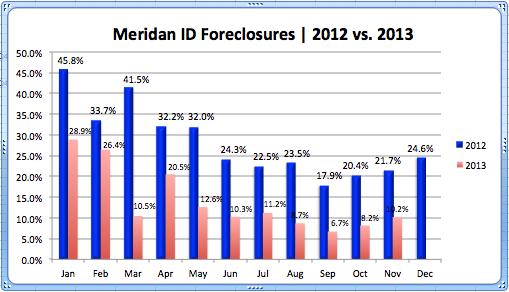
The graph below gives a snap shot of the drop we’ve been seeing this year on the foreclosure rate in general. The most recent foreclosure rate in November was 10.2% of real estate sales. This reflects a 52% drop in just one year, compared to a 21.7% foreclosure rate in November the previous year. The decline shows the increased stability we’ve been seeing this year in the market not only in Meridian but also through the entire county. Also, the low rate has only varied slightly since early summer, varying between 10.3% and 6.7%.

Meridian ID Foreclosures

Disclaimer

Meridian ID Short Sales Fall 13% in 2012

Meridian ID short sales have fallen 13% compared to one year ago.  In 2012 there were 314 short sales, while there were 360 in 2011.  In addition, of the 1,894 Meridian Idaho real estate sales in 2012, 16.6% of them were short sales.  In 2011 about 21% of total sales were short sales.  The chart below shows short sales in Meridian ID for the past two years.  Most months in 2012 had fewer Meridian ID short sales than the same months in 2011.

Meridian ID Short Sales 2011 vs. 2012

Of all foreclosure sales (short sales, REO, & HUD properties) Meridian ID short sales were the most dominant in 2012, while REO sales were more dominant in 2011.  That’s because Meridian Idaho bank-owned & HUD properties have fallen dramatically from 459 in 2011 to just 176 in 2012.  That accounts for a 62% drop in REO & HUD sales in 2012.

Meridian ID Bank-Owned & Hud Homes 2011 vs. 2012

In 2011, 42% of Meridian ID foreclosures were short sales.  Because fewer REO properties are available, short sales accounted for nearly 60% of total distressed sales in 2012.  Also, in 2012, short sales in Meridian ID were on the market a shorter period of time than in 2011.  The median amount of time on the market in 2011 was 159 days.  Short sales sold nearly a month sooner in 2012 (133 days).

Disclaimer


Meridian ID Short Sales Statistics | October 2012

The number of Meridian ID short sales has gone down compared to one year ago.  In fact, according to the chart below, most months this year have either been under or posted the same number as in 2011, with a couple exceptions.  For example, during the month of July there were 28 short sales; there were 20 in July 2011.  Still, last year there was an average of 30 short sales in Meridian each month.  And while the year isn’t quite over yet, the average for 2012 is 26.

Meridian Short Sales 2011 vs. 2012

While data shows Meridian ID short sales have gone down compared to one year ago, these  types of sales exceed Meridian bank-owned and HUD properties.  The graph below shows that most months had similar numbers, except for the summer months.  It’s interesting to point out, though, that foreclosure sales were significantly down compared to traditional sales.

Meridian ID Real Estate Sales by Type 2012 Stats

The foreclosure market share is also significantly smaller because Meridian ID short sales and bank-owned homes have slowed since 2011.  You can see that since the month of June, foreclosures have consistently made up less than 25% of total sales.  Those are numbers we haven’t seen since IMLS started collecting data in 2009.

Meridian ID Foreclosures 2011 vs. 2012

Disclaimer

Meridian ID Short Sales | Jan. – June 2012

Meridian ID short sales have outpaced bank-owned and HUD properties for the first half of 2012.  As can be seen in the following illustrations, Meridian Idaho short sales have been the same or slightly higher than the sales of bank-owned (REO) or HUD properties since January 2012.  This is in sharp contrast to the first half of 2011 when the sale of bank-owned and HUD properties were higher than short sales, sometimes by as much as 48%.

Meridian Home Sales by Type | Jan. - June 2012

Meridian Idaho Home Sales by Type | Jan.-June 2011

The ratio of bank-owned properties and Meridian Idaho short sales is not the only difference in the Meridian Idaho real estate market for 2012.  The number of non-foreclosure sales compared to foreclosures and pre-foreclosures has seen a major increase.  In January 2012, there were 45 non-foreclosure sales.  Monthly sales have since risen steadily and in June there were 137 non-foreclosure sales in Meridian Idaho.  This is an increase of 204%.  During this same time period, the number of Meridian ID bank-owned, HUD properties and Meridian ID short sales have decreased.

Meridian ID Foreclosure Market Share | Jan.-June 2012

In 2011, the foreclosure market share ranged between 41.8% and 65.2%.  In 2012, the Meridian Idaho foreclosure market share ranged between 22.5% and 45.8%.

disclaimer

Meridian Idaho Short Sales | Home Sale Update

Meridian Idaho short sales for 2011 were higher than 2010 for most of the year.  The exceptions were June and July when 2011 short sales dropped below 2010 levels for the first time since January; and December 2011, when the number of Meridian Idaho short sales equalled 2010 totals.

Meridian Short Sales  | 2011 vs 2010

In 2011, Meridian bank-owned properties declined from a high of 59 in May to a low of 31 in December.  This is vastly different from 2010 when the number of bank-owned properties increased dramatically during the last two months of the year.

Meridian Bank-Owned Properties | 2011 vs 2010

The market share of Meridian Idaho short sales and bank-owned properties (foreclosure properties) for 2011 were above 50% for January through April, dropping below 50% in May  2011 for the first time since November of 2010.  The percentage of foreclosures stayed below 50% from May through the remainder of the year.

Meridian Foreclosure Market Share | 2011 vs 2010

This trend in bank-owned and short sales in Meridian Idaho is dramatically illustrated in the graph below. As can be seen, beginning in May 2011, non-foreclosure sales vastly outnumbered foreclosures, sometimes by more than double.

Meridian Home Sale by Type | 2011

disclaimer